Predicting Mycophenolic Acid Area under the Curve with Mycophenolic Acid Trough in De Novo Renal Transplantation
Shiong Shiong Yew 1,2, Robert Caroll2,3, Hanh Tran2, Patrick T Coates2,3.
1Nephrology , Mahkota Medical Centre, Melaka, Malaysia; 2Nephrology , Royal Adelaide Hospital , Adelaide , Australia; 3Faculty of Health and Medical Sciences, University of Adelaide, Adelaide , Australia
Introduction: Variable mycophenolic acid (MPA) trough versus area under the curve (AUC) relationship in the early post-transplant period has spurred different opinions regarding the preferred method for MPA monitoring. Earlier evidence suggested improved precision of MPA trough-AUC relationship with tacrolimus co-therapy as compared to cyclosporine. Thus, we explored the potential role of MPA trough as a screening for MPA exposure in the setting of tacrolimus co-therapy.
Materials and Methods: This is a retrospective single centre analysis of medical records and labarotary results. All MPA levels were measured using HPLC (High Performance Liquid Chromatography) assay, and AUC results were calculated using the trapezoidal method with MPA levels measured at 0, 1, 2 and 4 hours of MPA dosing. Only MPA levels during the first 90 days post-transplant for patients on mycophenolate mofetil (MMF) and tacrolimus co-therapy were included. The final study population was 227.
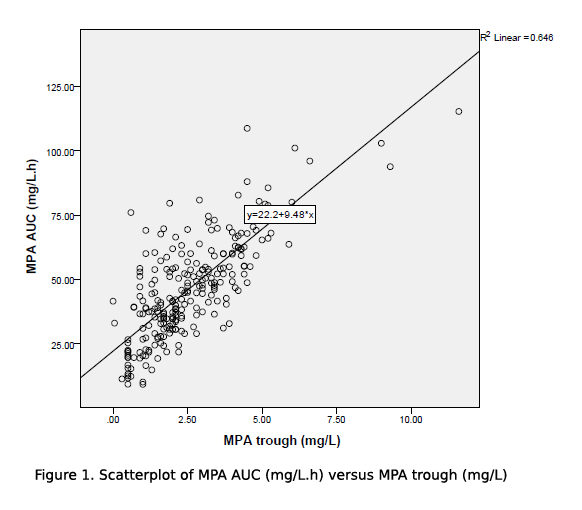
Results and Discussion: MPA levels were taken at 17.8±31.5days post transplant. Mean MPA AUC and trough levels were 46.5±21.5mg/L.h and 2.6±4.4mg/L respectively. The MMF doses were 1998±360mg/day, and 26.5±7.6mg/kg/day after being weight adjusted. The MMF dose, despite weight adjustment, did not correlate with MPA trough nor MPA AUC levels. MPA AUC was well associated with MPA trough in our study population, with r2=0.6427, F(1,225)=404.774, p=0.001 using ANOVA model for linear regression correlation (figure 1).
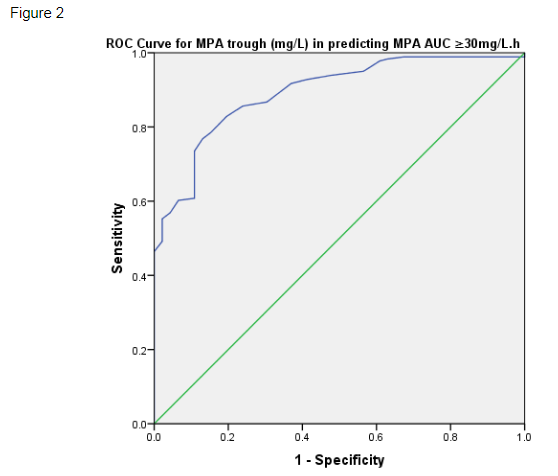
Using the receiver operating characteristic (ROC) curve, MPA trough was shown to be a good predictor of MPA AUC ≥30mg/L.h (figure 2). When applying a conventional MPA trough target for tacrolimus co-therapy, MPA trough ≥1.6mg/L had 85.6% sensitivity in predicting MPA AUC ≥30mg/L.h, with a specificity of 76.1% (ROC AUC 0.893, SE 0.024, p<0.001).
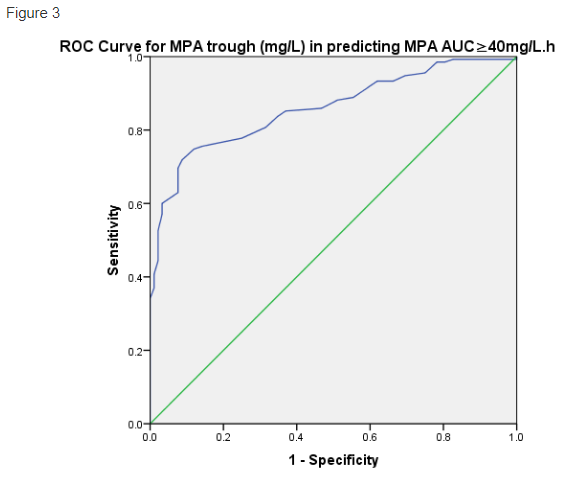
The ROC curve for MPA trough in predicting MPA AUC ≥40mg/L.h was similarly good, with ROC AUC 0.859, SE 0.024, p<0.001 (figure 3). For a higher MPA AUC target, MPA trough ≥1.6mg/L had 88.1% sensitivity in predicting MPA AUC ≥40mg/L.h, but a low specificity of 48.9%. In view increased specificity is desired to ensure adequate MPA exposure, we explored higher MPA trough cutoffs to predict MPA AUC ≥40mg/L.h, and found MPA trough ≥1.9mg/L had a 80.7% sensitivity and 68.5% specificity in predicting MPA AUC ≥40mg/L.h, while MPA trough ≥2.2mg/L had 75.6% sensitivity and 85.9% specificity in predicting MPA AUC ≥40mg/L.h.
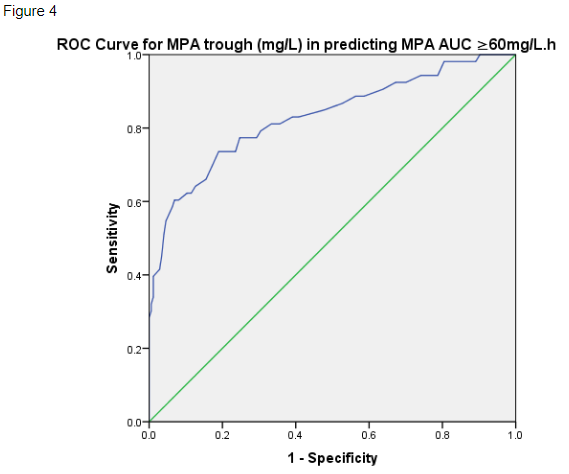
In assessing for MPA over-exposure, MPA trough ≥4mg/L had 57.4% sensitivity and 93.6% specificity in predicting MPA AUC ≥60mg/L.h (ROC AUC 0.83, SE 0.36, p<0.001) (figure 4).
Conclusion: This study supported using MPA trough as a screening for MPA drug exposure in de Novo renal transplant cases on MMF and tacrolimus co-therapy. This can provide cost and logistic benefits to both patients and healthcare providers.