Correlation between Pre-Transplant Bead-Based Screening of Anti-HLA Antibodies and Single Antigen Arrays
Renaud Snanoudj1,3, Jérémy Siemowski2, Vassil-David Kheav2, Nadia Arzouk4, Marie Matignon5, Christophe Legendre6, Michel Delahousse1, Sophie Caillat-Zucman2, Jean-Luc Taupin2,3.
1Nephrology, Hôpital Foch, Suresnes, France; 2Histocompatibility , Hôpital Saint-Louis, Paris, France; 3UMRS 1160, INSERM, Paris, France; 4Nephrology, Hôpital Pitié-Salpétrière, Paris, France; 5Nephrology, Hôpital Henri-Mondor, Créteil, France; 6Nephrology and Transplantation, Hôpital Necker, Paris, France
Introduction: Generalization of solid-phase bead-based assays has dramatically modified the definition of HLA sensitization in patients waiting for an organ transplant. Because of their lower cost, Luminex screening tests are often the first line and the main follow-up technique, single antigen (SA) approach being performed only when screening is considered positive. As no data are available, we aimed at exploring the correlations between these two techniques, the predictive value and the optimal thresholds of screening tests.
Methods: We studied 4430 recipients of their first organ-transplant, with at least one pre-transplantation screening and one SA test, both from the manufacturer One Lambda. We reanalyzed all raw MFI data for these two techniques. For screening tests, we considered the bead with the highest signal-to-noise ratio calculated according to the manufacturer’s recommendations.
Results:Transplants were mainly kidney (64%), liver (13%), heart (12%) and lung (10%). Mean recipient age was 48.8±18.8 years. During pre-transplant follow-up, median [IQR] of peak screening ratios was 3.8[2.1-9.7] for class 1 and 2.1[1.3-4.4] for class 2. Patients with a history of pregnancy or transfusion had significantly higher screening ratios than patients without: for class 1, 7.6 [3.5-32.8] versus 3.9 [2.4-7.2] and for class 2, 3.2 [1.7-9.6] versus 2.3[1.5-4.1], (Wilcoxon test, p<1.10-11). Figure 1 shows frequency of sensitization according to two frequently used thresholds for screening and SA tests.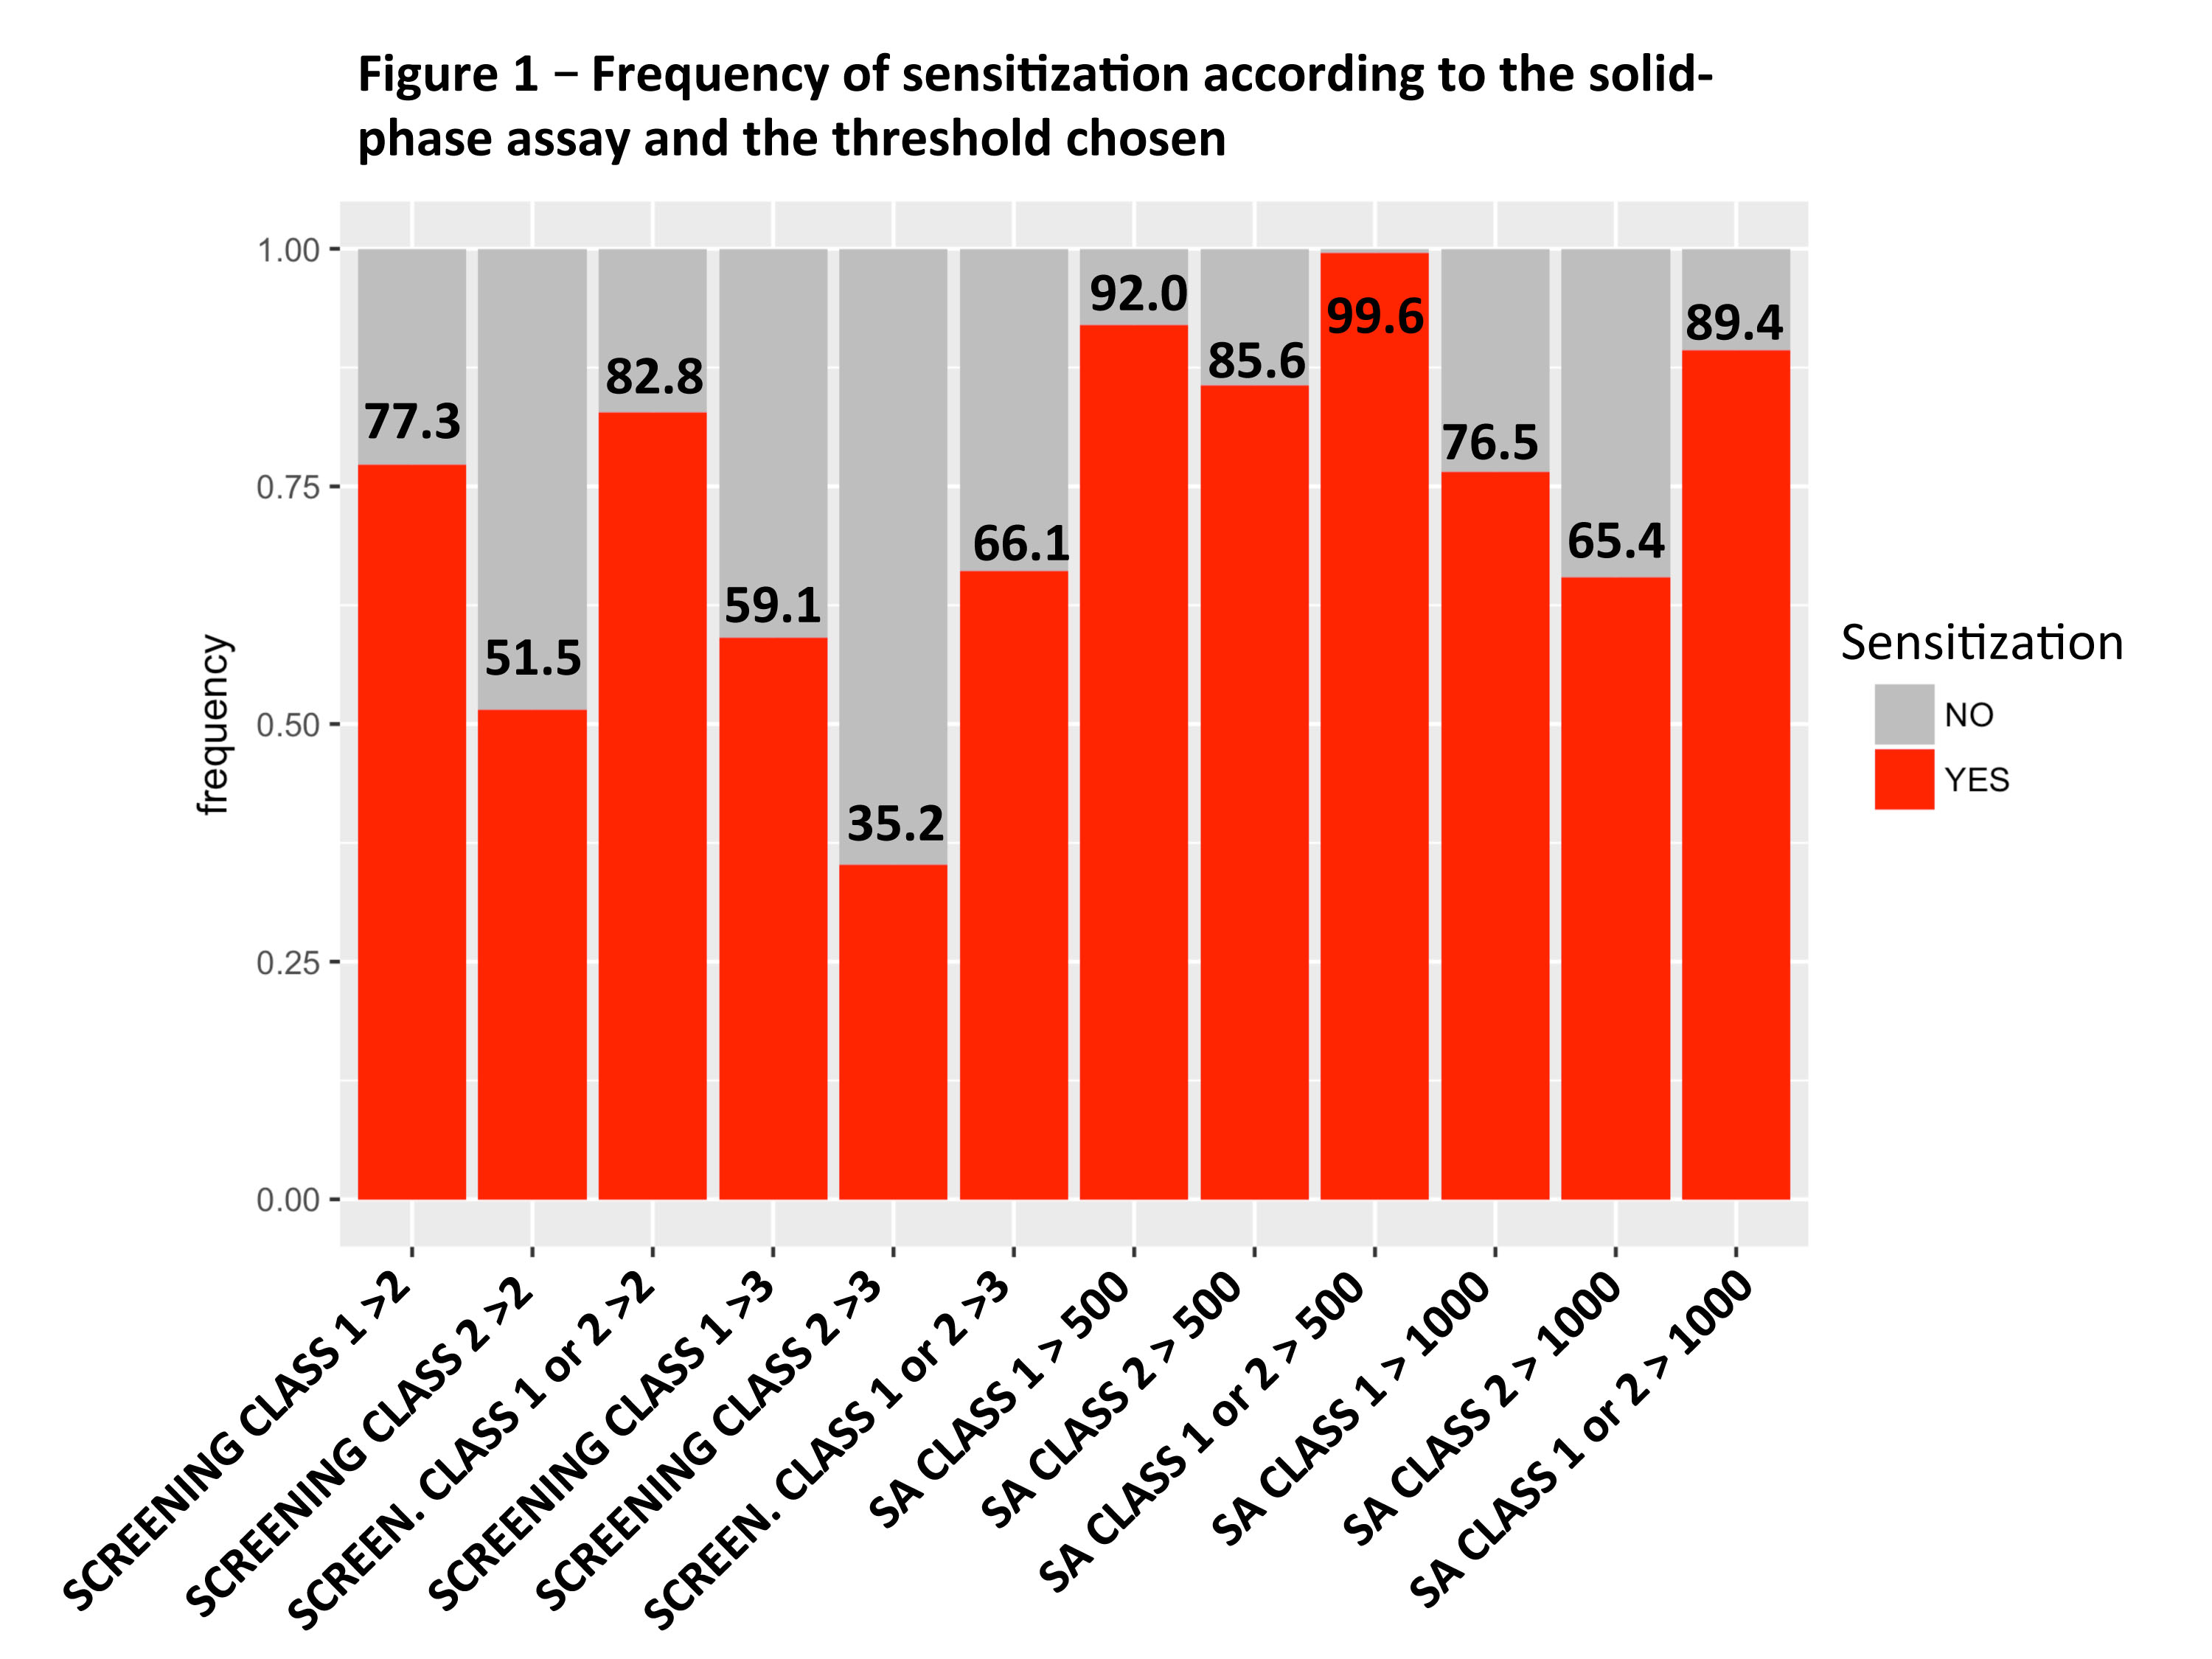
For class 1 and 2, there was a linear relation between the screening ratio and the SA bead with maximal MFI, but it was significant only for ratios above the median value. Principal component analysis revealed that screening ratio mostly correlated with the sum of SA beads MFI, maximal SA bead MFI and the number of positive SA beads (Figure 2). We performed ROC (Receiver Operating Characteristic) analysis to find the optimal screening threshold predictive of a positive SA test (at least one positive bead with a MFI > 1000). For class 1 and 2, AUC were 0.719 and 0.642 and optimal ratio thresholds were 3.3 and 2.1.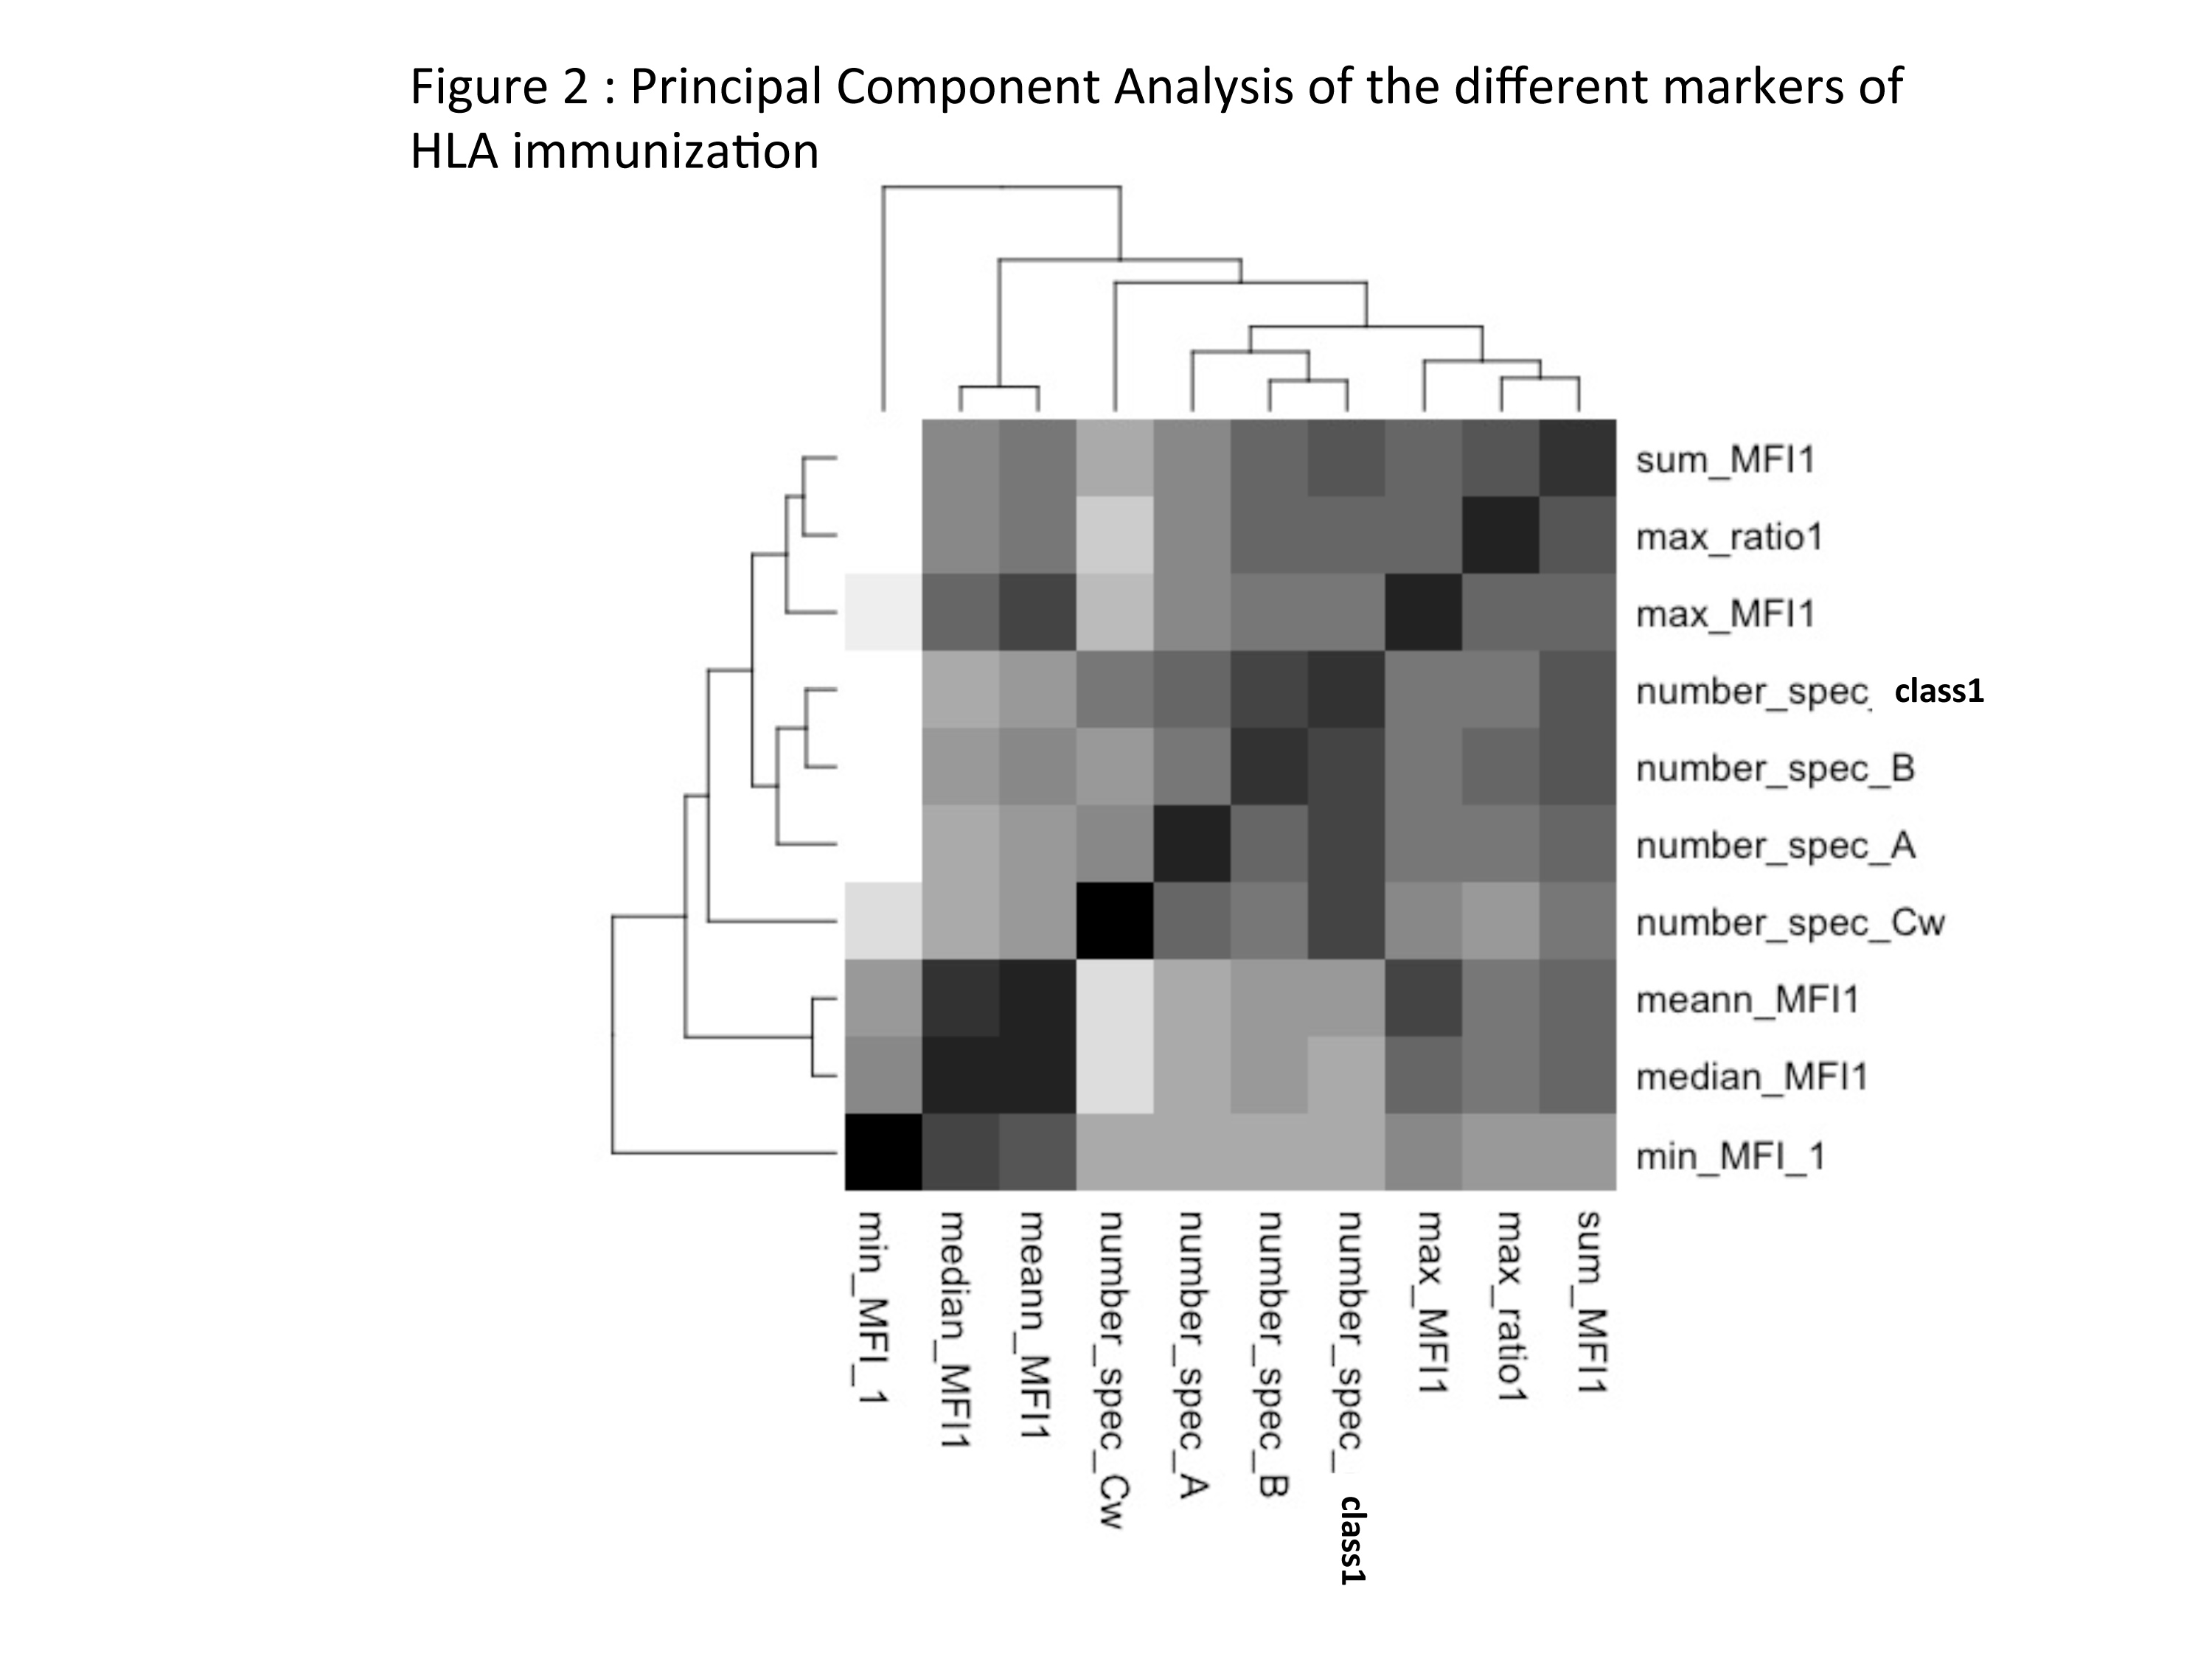
The median MFI of SA profiles corresponding to ratios above these thresholds were 3635 versus 1291 for class 1 and 2088 versus 1204 for class 2 (Wilcoxon test compared to sera below the threshold, p< 2.2e-16). However, using these thresholds, 25% of sera considered as negative for screening had a class 1 maximal MFI > 2419, and a class 2 maximal MFI > 2063.
Conclusion: In a low immunological risk population of patients waiting for a transplant, definition of HLA sensitization is highly dependent on the solid phase assay technique and the threshold chosen. The correlation between Luminex screening and SA is significant only for screening ratios above the median value. The predictive value of screening tests regarding results of SA is low to moderate and optimal thresholds are different for class 1 and 2.
This study was realized with the financial support of Assistance Publique Hôpitaux de Paris, Sandoz and CSL Behring France.