Extended Release Tacrolimus (LCP-TAC) Prolongs Calcineurin Activity Inhibition During Drug Doses Intervals
Pere Fontova1, Raul Rigo-Bonnin2, Anna Vidal-Alabró1, Gema Cerezo1, Oriol Bestard1, Edoardo Melilli1, Nuria Montero1, Anna Manonelles1, Joan Torras1, Josep M Cruzado1, Josep M Grinyó1, Nuria Lloberas1.
1Nephrology Department, Bellvitge University Hospital (IDIBELL), Hospitalet Llobregat, Spain; 2Clinical Laboratory, Bellvitge University Hospital (IDIBELL), Hospitalet Llobregat, Spain
Introduction: Tacrolimus (TAC) is the cornerstone calcineurin inhibitors most commonly used in renal transplantation. New extended release formulation of tacrolimus (LCPT-ER) (Envarsus®) offers better bioavailability and less fluctuation between maximum concentration (Cmax) and trough and with a lower peak level compared to immediate-release (TAC-IR) formulation (Prograf® or Adoport®). The more stable and less fluctuating TAC exposure of LCPT-ER may result in an optimized pharmacodynamic (PD) profile with a more sustained inhibition of calcineurin activity (CNA) during dose intervals.
The goal of this study is to compare the CNA area under the curve (AUC) between LCPT-ER and TAC-IR formulation in kidney stable transplant patients and their correlation with their corresponding TAC exposures.
Methodology: An open-label, prospective, non-randomized study investigator-driven was conducted. Ten patients receiving TAC-IR in steady state were subsequently switched to LCPT-ER (dose conversion rate 1:0.7). Before and after conversion, pharmacokinetic (PK) and PD intensive analysis were conducted along 24 hours (Pre-dose, 0.5, 1, 1.5, 2, 3, 4, 6, 8, 12, 12.5, 13, 13.5, 14, 15, 20 and 24h). A validated method by UPLC-MS based on peptide dephosphorilation was used to measure CNA in peripheral blood mononuclear cells. TAC levels in whole blood were measured also by UPLC-MS. Concentration of TAC in blood is expressed in µg/L. CN activity is expressed in pmol of dephosporilated peptide/time x protein (pmol/m·mg). To evaluate the duration of CNA inhibition between drug doses intervals, the CNA Imax was subtracted to CNA at each time point (AUC PD Imax).
Results: PK results showed that LCPT-ER presented lower Cmax and higher dose normalized AUC PK0-24 than TAC-IR statistically significant. These results are illustrated in table 1. 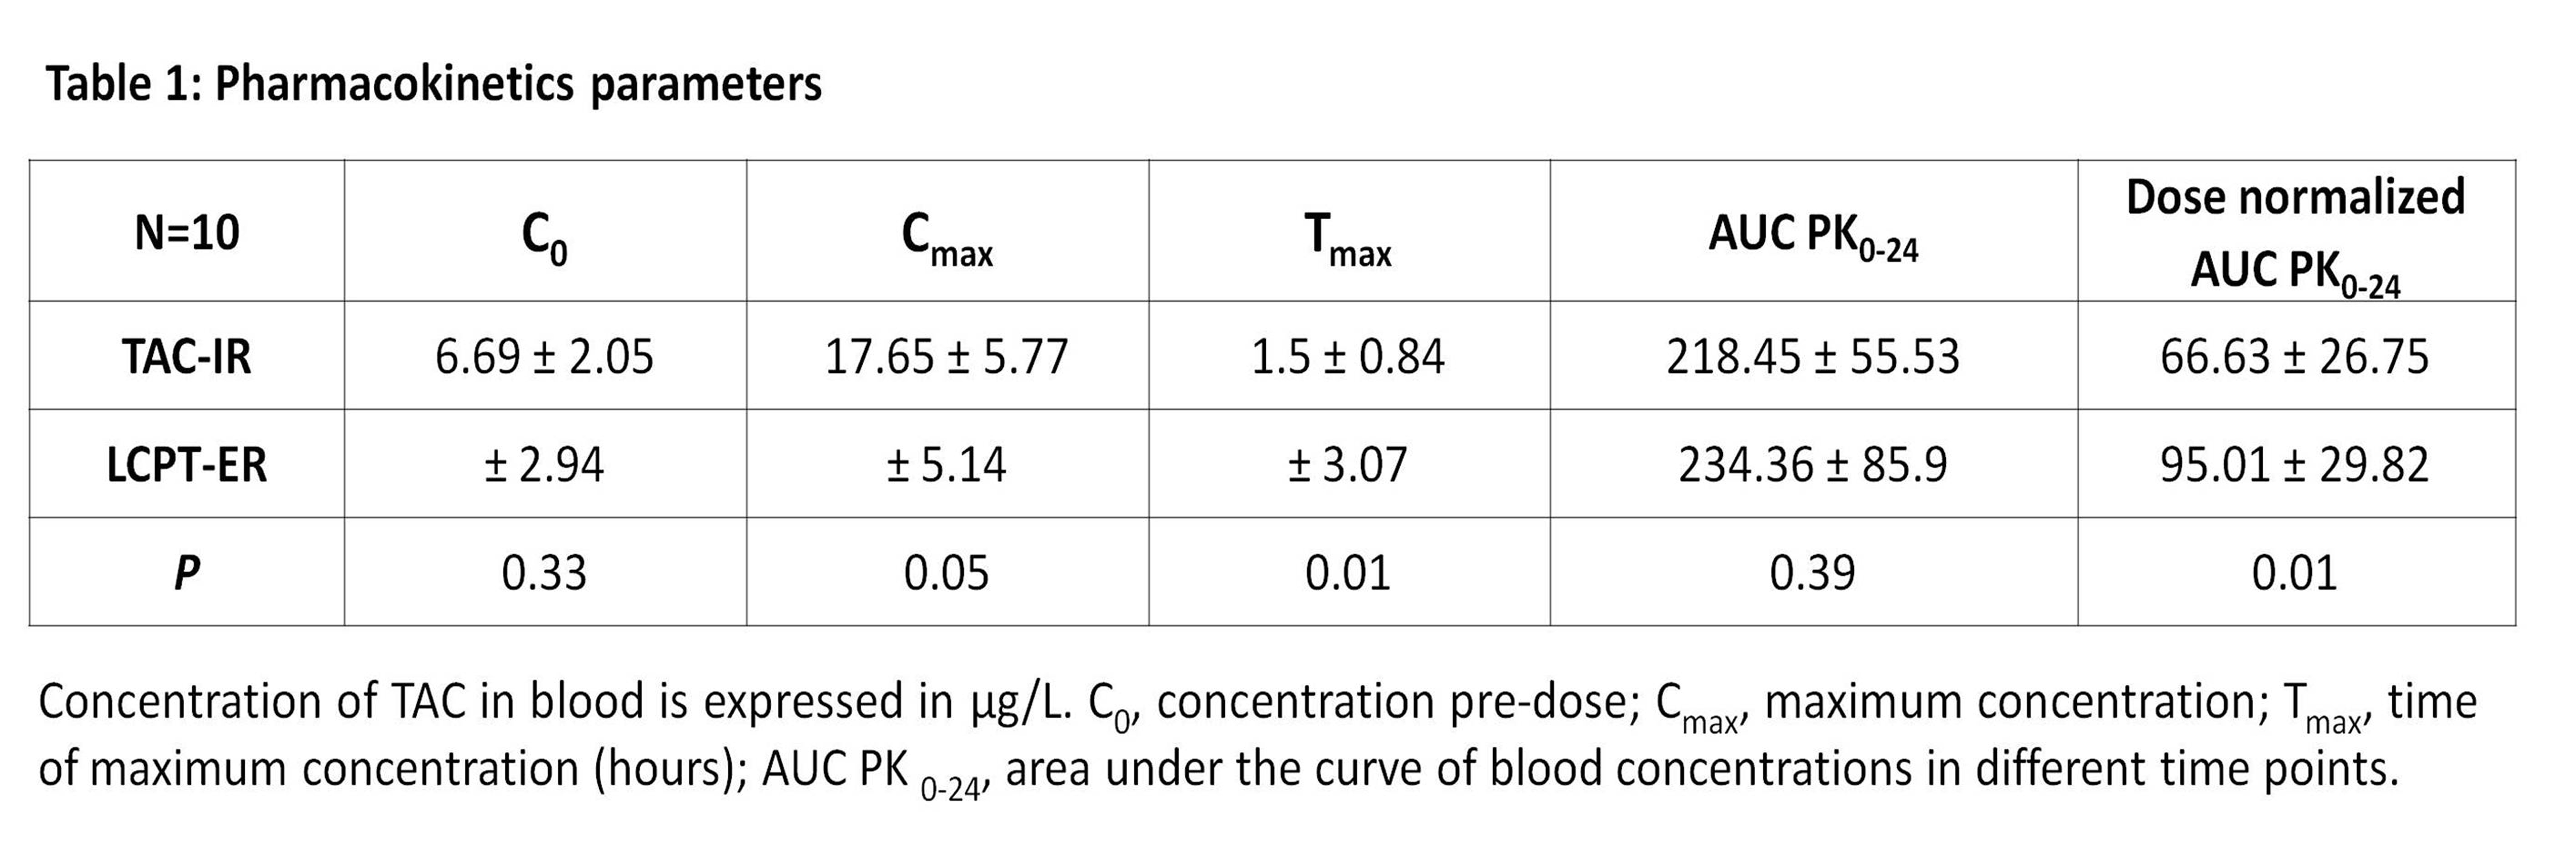
AUC PDIo displayed similar values between LCPT-ER and TAC-IR, but as PK, LCPT-ER achieved significative higher inhibition when they were normalized by doses. A lower AUC PDImax value of LCPT-ER was obtained, indicating more maintained inhibition along the curve. PD parameters are shown in table 2 and an illustration of CN activity during 24 hours with both formulations is presented in figure 1. 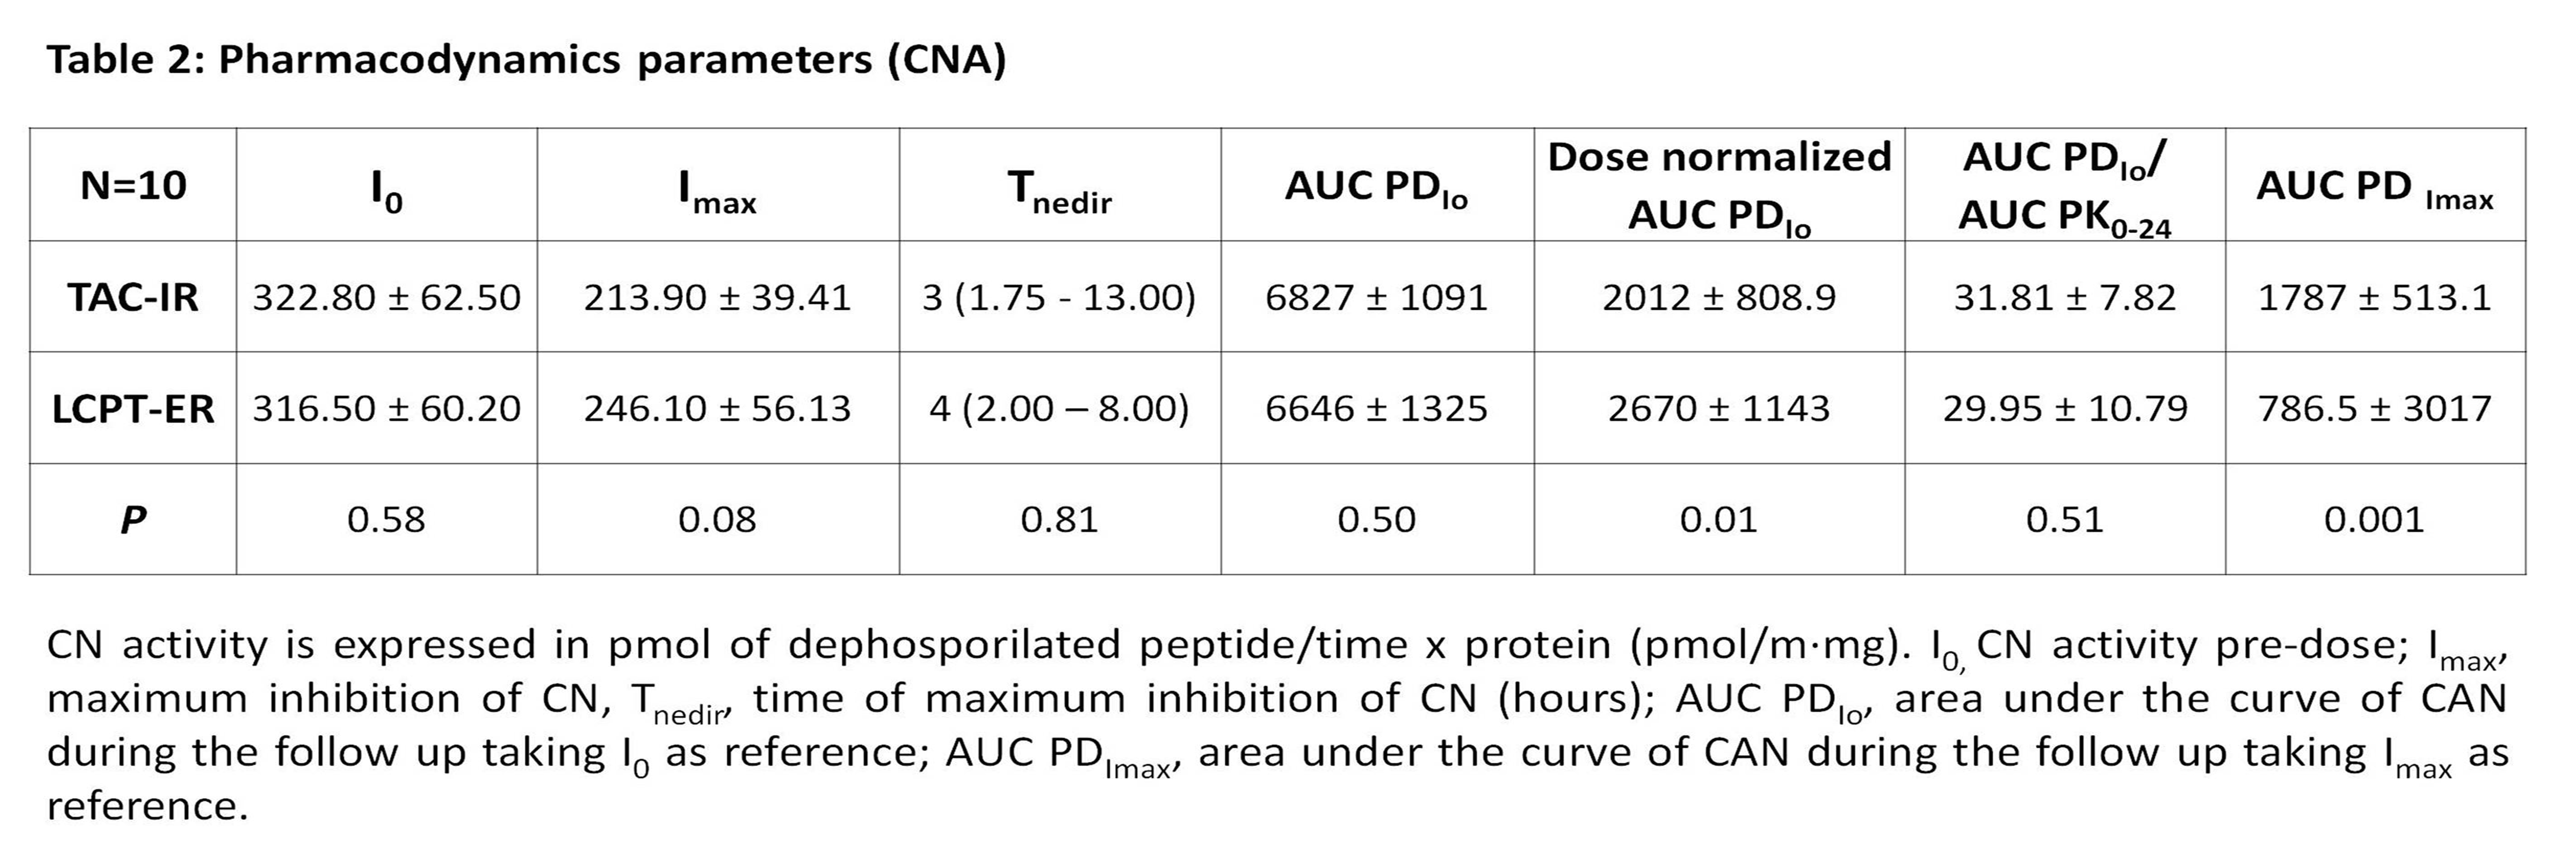
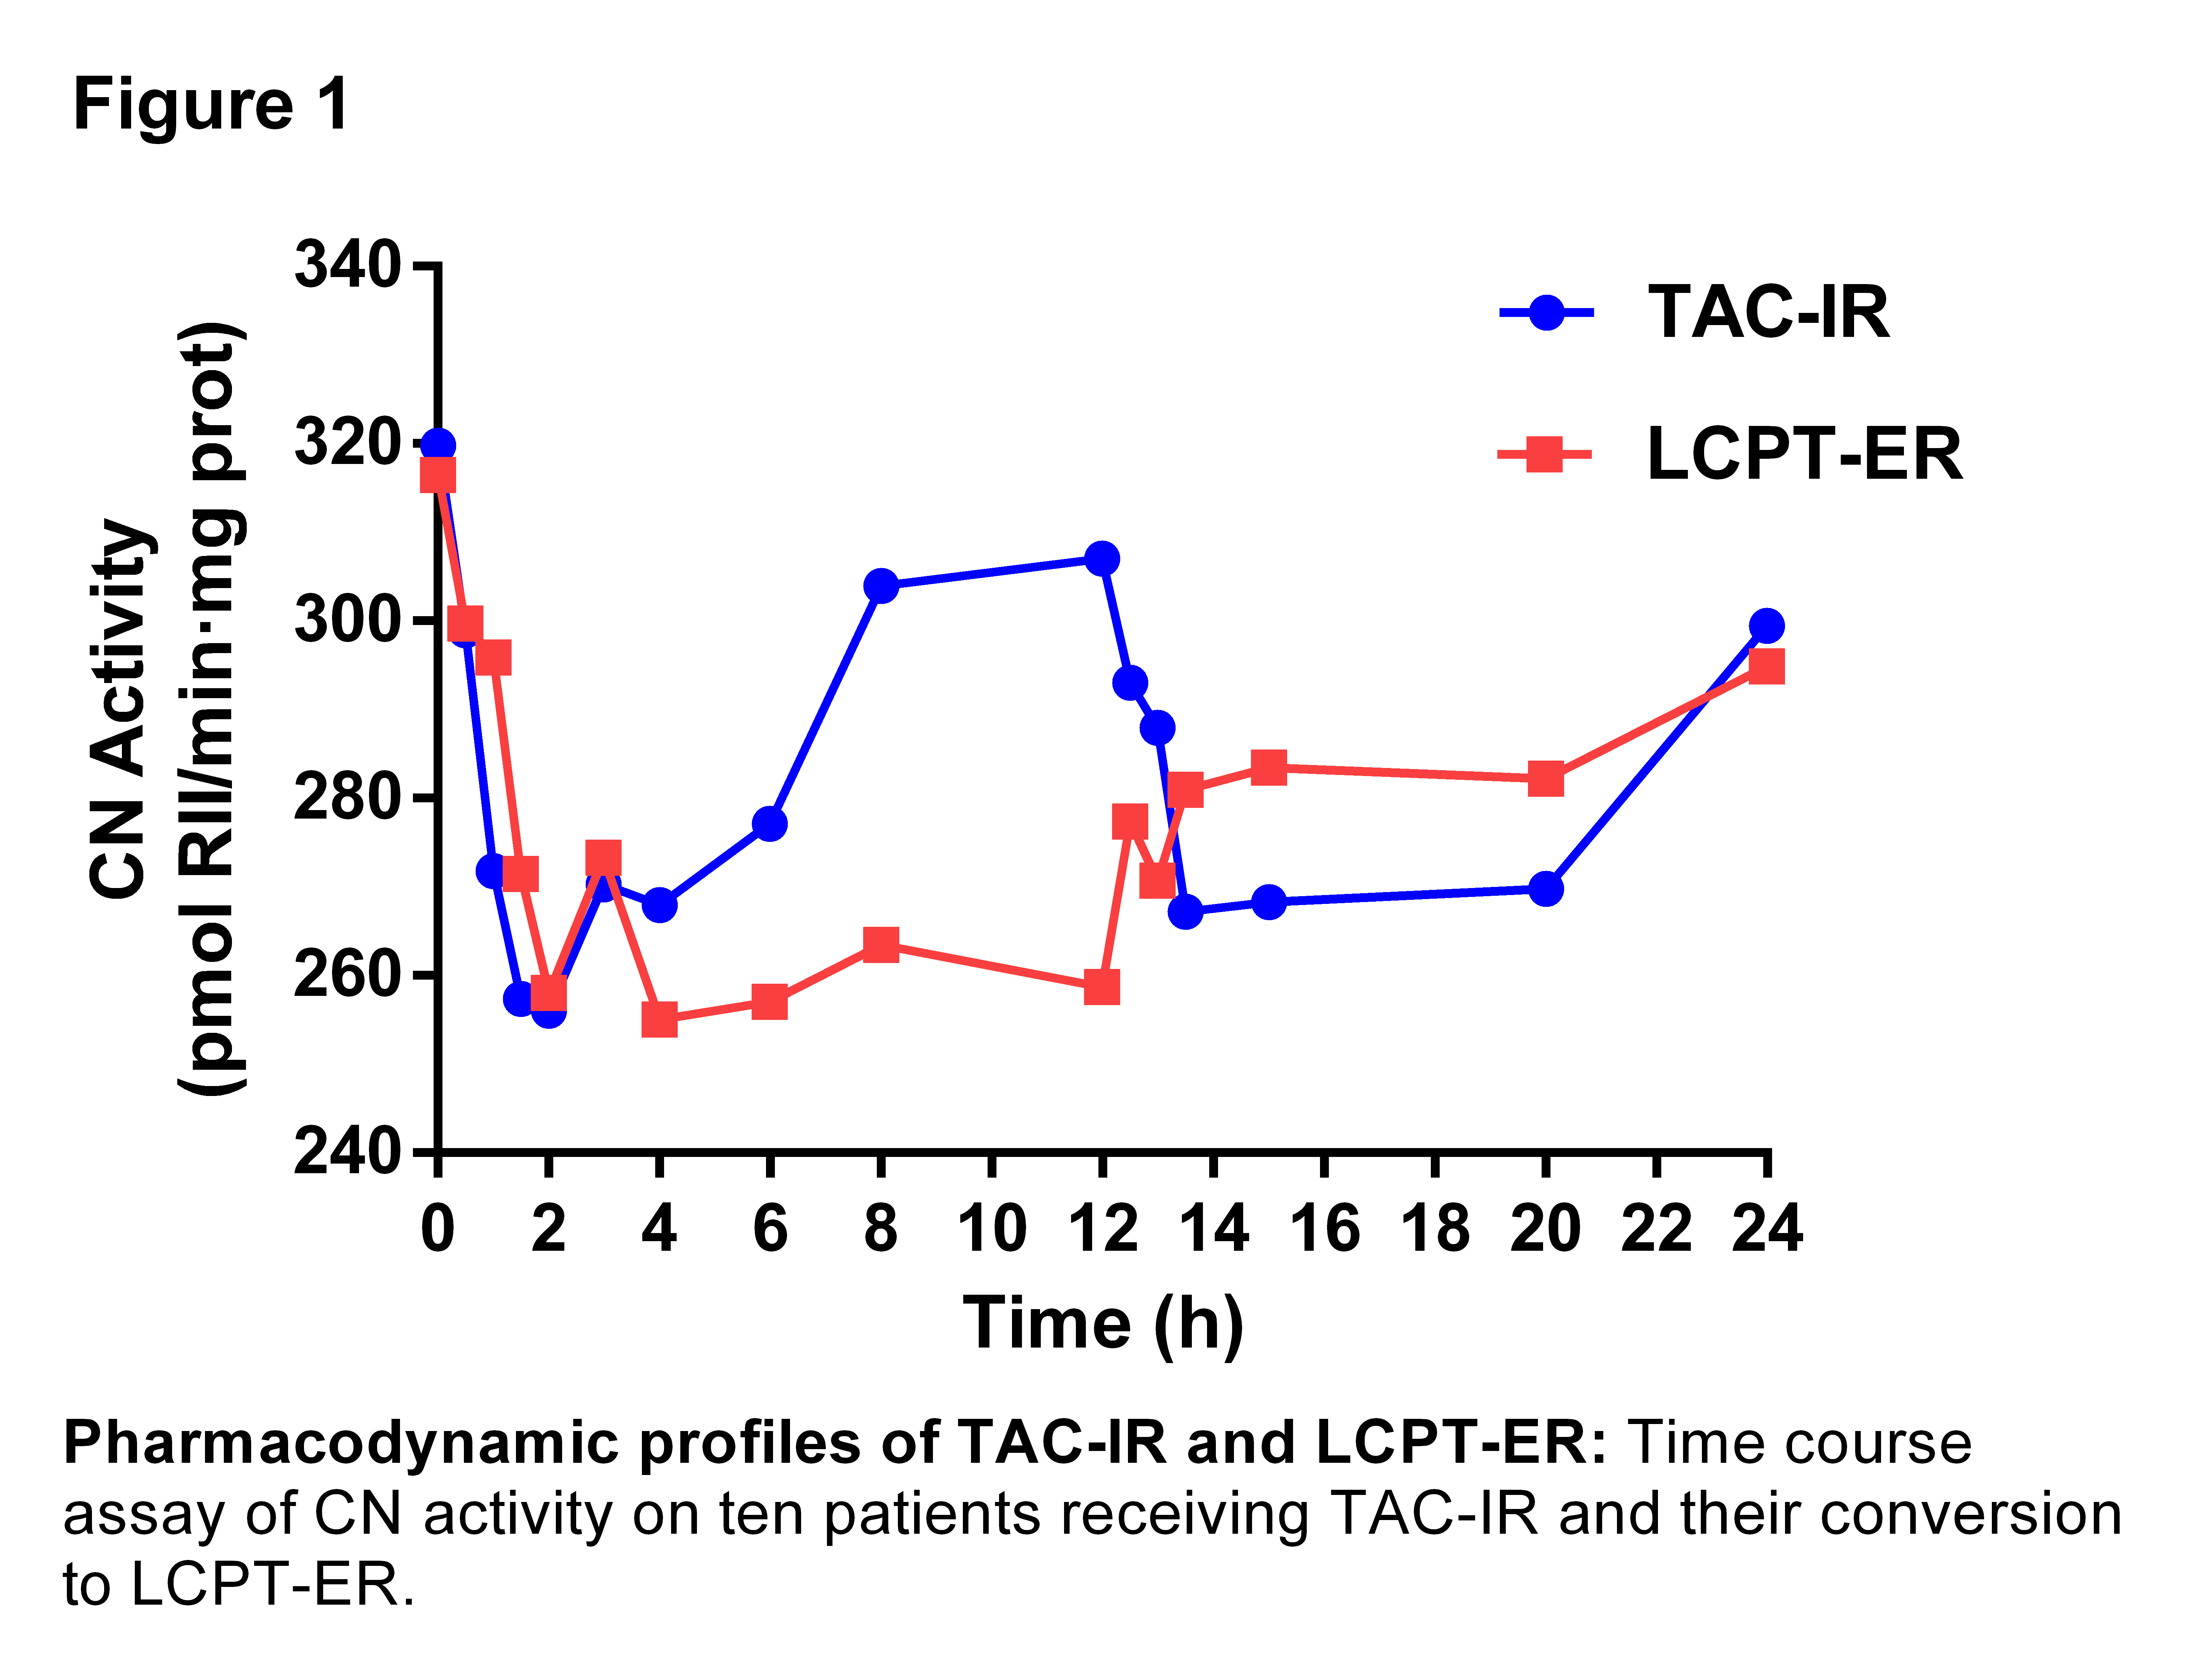
Conclusions: Our results expressed that with lower doses of LCPT-ER similar TAC exposure and CNA inhibition were obtained. Furthermore, LCPT-ER showed a CNA inhibition-time curve strongly more maintained along drug doses intervals compared with TAC-IR formulation. Only with LCPT-ER formulation, CNA levels did not reach the pre-dose in any point of the PD study.
An unrestricted grant from Chiesi..