Correlation of Dynamic Immune Cell Profile with Individual Alloresponse and Outcome in Type 1 Diabetes Islet Transplantation Recipients
Min Hu1, Elvira Jimenez Vera1, Yi Vee Chew1, Heather Burns1, Patricia Anderson1, Lindy Williams1, Karen Keung1, Suat Dervish2, Xin Maggie Wang2, Natasha Rogers1, Shounan Yi1, Wayne Hawthorne 1, Stephen Alexander3, Philip O'Connell 1.
1Centre for Transplant and Renal Research, Westmead Institute for Medical Research, University of Sydney, Westmead, Australia; 2Flow Cytometry Core Facility, Westmead Institute for Medical Research, University of Sydney, Westmead, Australia; 3Centre for Kidney Research, Children's Hospital at Westmead, , Westmead, Australia
Aim: To evaluate dynamic whole blood immune profile(WBIP) of T1D islet transplant(Tx) recipient(R) pre &post-transplant(Tx), and evaluate for correlation with Tx outcomes.
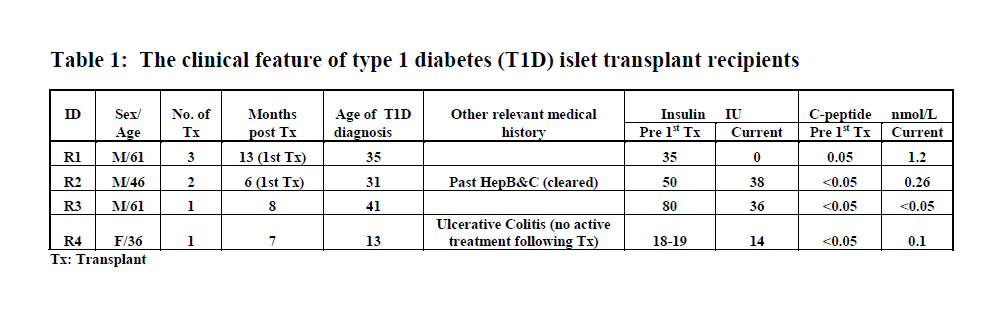
Materials and Methods: WBIP of 9 T1D non-Tx patients & 8 volunteers was analyzed by FACS for absolute numbers of WCC, granulocyte(GR), monocyte(MO), B, NK, &T cells including NKT. WBIP of 4 Tx recipients(R1-4) was performed pre-Tx &post Tx [(at 2 weeks(w), &1, 3, 6, &12 months(m)]. R1 received 3 Tx, R2 received 2 Tx, and R3 & R4 had 1 Tx. The fold change of cell populations following Tx was compared to levels prior to 1st Tx. The induction immune suppression was ATG/Tacrolimus/MMF/Etanercept(Eta), except R1 didn't receive Eta at his 1st Tx.
Results: All analyzed subjects (for R1-4, prior to their 1st Tx) had levels within normal range for all assessed immune cells; except R2 who had an elevated WCC(1272cells/uL) due to high GR(9383cells/ul). The current clinical progress of the recipients is summarized in table 1. R1 had a significant reduction in insulin requirement after the 2ndTx, and was insulin free after the 3rd. In R1 during the 13m post-1st Tx, T cells were greatly reduced(3.7/43fold), and to a lesser extent MO, B & NK cells(1/3.8fold)(Fig1). Minor reductions in GR & NKT cells was observed(≤1.5fold) after 1st Tx in R1, but much greater reductions were seen (3/13.5, vs 9/11fold) within the 1st m following his 2nd and 3rd Txs. Of note, Eta was not given with the 1st Tx(Fig.1). R2 remains on insulin after 2 Txs, but with a partial reduction in insulin use. The degree of decline of T cells during the 6m post Tx(2.5/6.7fold) was less marked than in R1, R3 & R4 at the same time points. Slight reductions in GR, MO, NK, NKT & B cells(1.2/3.2fold) was also observed, while there was an increase in NK(1.5fold) and NKT(1.3fold) at 3m and 1m respectively post-Tx (Fig.1). In R3 remains on insulin after 1 Tx, but dosage has halved. Over the first 6m post Tx, there was a decline in T cells (4/8.8fold), B cells (1.5/2.4fold), NK (1.4/2.8fold) and GR(1/1.2fold) while MO increased slightly (1.1fold) at 2w post-Tx, but then declined at subsequent time points(Fig.2). In R4 after 1 Tx who has a partial reduction in insulin dosage, there were marked reductions in T cells and NKT (27/77fold, & 15.2fold) within the 6 months following Tx; while declines in B (2/3fold), NK(5/10fold), and MO (1.4/2.9fold) cells was seen(Fig 2). However, there was a rise in the GR (2.7fold) at 1m Post-Tx, which subsequently returned to pre-tx levels (Fig 2).
Discussions: We observed the changes of dynamic WBIP to immunosuppression differed between individual Tx recipients despite similar regimens, and the reduction degree in T cells did not correlate with successful outcomes. Conclusion: Dynamic WBIP after Tx can be performed and used to evaluate an individual’s response to Tx and immunosuppression. Monitoring WBIP may be important after Tx to guide the usage of immunosuppression.